RoCEv2 Fabric Telemetry
RoCEv2 lives or dies on its congestion-control loop. Because the fabric is supposed to be lossless, observing RoCEv2 is mostly about watching that loop stay healthy — and catching the drops it exists to prevent.
This page reads the loop end to end from the counters each stage leaves behind. Everything below comes in three flavors — NVIDIA/Mellanox (host ethtool/rdma + Spectrum switches), Broadcom/SONiC (the open NOS most white-box fabrics run), and vendor-neutral gNMI/OpenConfig (streaming telemetry that works across vendors) — because you will operate a mix.
- Read the congestion-control loop — ECN mark → CNP → DCQCN rate cut → PFC — and name the counter that proves each stage fired.
- Slice to the RoCE priority — why aggregate port counters hide everything and you must watch TC3 (and CNP on prio 6).
- Get drop visibility — WJH reason codes and the SONiC PFC watchdog turn "a packet was lost" into "port et33 tail-dropped a TC3 packet at 14:03:07."
- Correlate NIC ↔ switch — pair the NIC retransmit family (
packet_seq_err,out_of_sequence) with the switch's drop reason. - Use watermarks as a leading indicator — buffers fill before PFC fires, so occupancy warns you one step earlier.
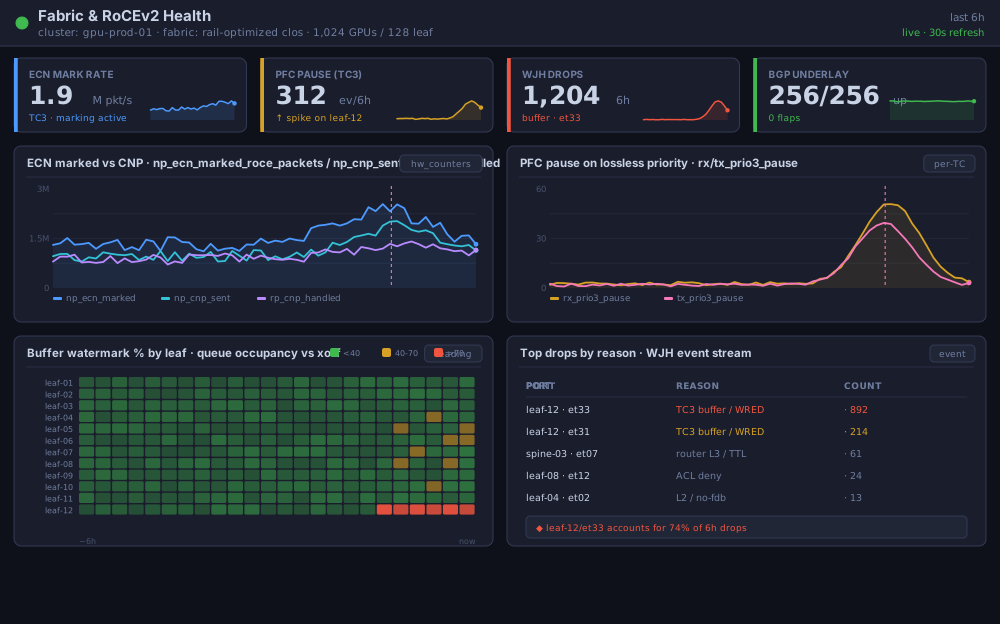
Every counter on this page, on one screen — the congestion loop (ECN/CNP/PFC), the watermark-by-leaf heatmap, and WJH drop reasons. Open the live interactive demo →
Watching the congestion-control loop
The loop has four stages, and each leaves a counter behind. Read them in order and you can see exactly where the loop is working and where it's stalling.
- A switch queue fills → the switch ECN-marks packets (sets the CE bit) once occupancy crosses
Kmin, with rising probability up toKmax. - The receiver (Notification Point) sees CE-marked RoCE packets and sends a CNP back to the sender.
- The sender (Reaction Point) receives the CNP and cuts its rate via DCQCN (adjusting the per-QP
alphacongestion estimate). - If the queue keeps filling past the PFC threshold (
xoff), the switch sends PFC pause — the blunt, last-resort brake.
The NIC-side counters that prove each stage (all under /sys/class/infiniband/<dev>/ports/1/hw_counters/, or via rdma statistic show link <dev>/1):
| Counter | Role | Meaning |
|---|---|---|
np_ecn_marked_roce_packets | receiver | RoCE packets arriving already ECN-marked (congestion seen upstream) |
np_cnp_sent | receiver | CNPs this node sent back to throttle a sender |
rp_cnp_handled | sender | CNPs this node received and acted on (rate reduced) |
rp_cnp_ignored | sender | CNPs received but not acted on — a red flag |
roce_slow_restart_cnps | sender | CNPs that triggered slow-restart rate recovery |
Healthy vs. unhealthy. The design intent is ECN-first, PFC-rarely: you want np_ecn_marked and CNPs moving (the fine-grained, per-flow brake doing its job) while PFC pause counters stay near zero. If PFC is climbing while CNPs aren't, DCQCN is reacting too slowly (or is misconfigured) and buffers are overrunning before the sender backs off. If rp_cnp_ignored is non-trivial, senders are being told to slow down and aren't — check that CNP is landing on the right priority and that DCQCN is enabled on the QP.
DCQCN keeps a per-QP alpha value estimating congestion severity; the first CNP sets the reduced rate, and rate only updates once per DcqcnRateReduceMonitorPeriod (extra CNPs inside that window don't compound). Historically, CNP hardware counters on some adapter/firmware combos have been imperfect — trust trends over absolute values, and corroborate with switch-side ECN marks.
Per-priority / per-TC counters
RoCE does not ride the default queue. It rides one specific traffic class — conventionally priority/TC 3 (DSCP 24), with CNP on priority 6 (DSCP 48). If you watch aggregate port counters you will miss everything, because the interesting pressure is on that one lossless priority. Always filter to it.
NVIDIA/Mellanox (host):
# Per-priority pause + ECN marks on the RoCE priority (3)
ethtool -S gpu0_eth | grep -E 'prio3|ecn'
#   rx_prio3_pause / tx_prio3_pause           <- PFC frames on TC3
#   rx_prio3_pause_duration                   <- time spent paused
#   rx3_ecn_mark                              <- ECN-marked packets on rx queue 3
Pause counters are only visible via ethtool for priorities on which PFC is actually enabled. A zero you can't find is different from a zero that's really zero — confirm PFC is enabled on TC3 first (mlnx_qos -i <netdev>).
Broadcom/SONiC (switch): per-priority PFC and per-queue stats come from the counters DB and CLI:
show interfaces counters                      # base port counters
show queue counters Ethernet33                # per-queue (TC) tx/drop
show pfc counters                             # per-priority PFC rx/tx
Vendor-neutral (gNMI/OpenConfig): subscribe to per-queue state under the QoS model — queue transmit-pkts, dropped-pkts, and ECN/WRED marked counters per interface/queue — streamed via gnmic subscribe. Exact leaf paths vary slightly by vendor's OpenConfig deviation, but the shape is /qos/interfaces/interface/output/queues/queue/state/....
| Signal | NVIDIA/Mellanox | Broadcom/SONiC | gNMI/OpenConfig |
|---|---|---|---|
| PFC pause (per prio) | ethtool -S … rx/tx_prio3_pause | show pfc counters | ethernet PFC state counters |
| ECN marked (per TC) | ethtool -S … rx3_ecn_mark (host) | WRED-ECN queue counters | qos queue WRED/ECN counters |
| Per-queue drops | — (see NIC error counters) | show queue counters | qos queue dropped-pkts |
Drop visibility — the invisible killer
A packet drop on a "lossless" fabric is both catastrophic and often invisible: a plain if_out_discards tells you a drop happened but not which flow, which queue, or why. Closing that gap is the highest-leverage thing you can add to a RoCE fabric's observability.
NVIDIA/Mellanox — WJH (What Just Happened): Spectrum ASICs stream event-based drop visibility with a reason code per dropped packet (buffer/WRED, ACL, L2/L3, etc.), as raw or aggregated data. This turns "a packet was lost" into "port et33 tail-dropped a TC3 packet due to buffer exhaustion at 14:03:07" — the single most useful line in a RoCE incident.
Broadcom/SONiC — PFC watchdog: detects a stalled lossless queue (receiving a persistent PFC pause storm while not draining) and can drop/forward to break head-of-line deadlock, exposing storm and drop counters:
show pfcwd stats
#  QUEUE        STATUS   STORM DETECTED/RESTORED   TX OK/DROP   RX OK/DROP
#  Ethernet0:3  stormed  2/1                       0/0          0/0
The underlying PFC_WD_QUEUE_STATS_* fields (STORM_DETECTED, TX_DROPPED_PACKETS, …) are pollable from the counters DB. A queue that keeps entering "stormed" is a deadlock hotspot pointing at a downstream congestion source.
Correlate NIC ↔ switch. On the NIC side, the retransmit/loss family proves the endpoint noticed the drop:
| Counter | Meaning |
|---|---|
out_of_sequence | packets arrived out of order (a gap — something was dropped/reordered) |
packet_seq_err | PSN sequence error (the receiver detected a missing packet) |
local_ack_timeout_err | sender timed out waiting for an ACK and retransmitted |
rnr_nak_retry_err | receiver-not-ready NAK retries (receiver couldn't accept) |
out_of_buffer | no receive buffer available (receiver-side starvation) |
The move is: NIC shows packet_seq_err / out_of_sequence rising on rank 47 → pull WJH / show pfcwd stats for the switch port rank 47 hashes to → find the drop reason. That's the whole game — and the full six-step version is the walk-down.
Buffer & watermark telemetry
Buffers fill before PFC fires, which makes buffer occupancy the leading indicator — the signal that lets you act before the blunt brake engages. If you only watch PFC/ECN counters you're always reacting one step late.
- NVIDIA/Mellanox: dynamic shared-buffer occupancy and per-port/per-PG watermarks; on Spectrum switches,
show buffer status interfaces ethernet <x/y>and the shared-buffer telemetry. - Broadcom/SONiC: the WRED/ECN profile defines the marking band —
Kmin,Kmax,Pmax— and the PFC headroom via the buffer profile (xoff,xon,xon-offset). Recommended ECNKmaxscales with speed (far higher at 400G than 100G). Watch queue watermarks to see how close occupancy runs toKmin/xoff. - Cisco SONiC (VOQ platforms):
show platform npu voq/cgm_profileexposes per-VOQ flow-control and drop-trigger bands. - Vendor-neutral: gNMI stream of per-queue peak/instant occupancy where the platform exposes it.
The interpretation:
- Rising average watermark = sustained load creeping toward the ECN band.
- Rising peak watermark with flat average = bursty incast, the classic all-to-all / AllReduce signature.
- Watermarks approaching
xoffmean PFC is about to fire — that's your early warning.
CNP / DCQCN health — the loop as a balance sheet
The first section read the loop from the top; here we read it across nodes. In a healthy fabric, CNPs sent by congested receivers and CNPs handled by the senders causing the congestion should move together — just on different machines:
# Watch the two ends of the loop
watch -n1 'grep -H . /sys/class/infiniband/mlx5_*/ports/1/hw_counters/{np_cnp_sent,rp_cnp_handled,rp_cnp_ignored}'
| Observation | Diagnosis |
|---|---|
np_cnp_sent ↑ on node B and rp_cnp_handled ↑ on node A | Loop closing correctly — B tells A to slow down, A complies |
np_cnp_sent ↑ but nobody's rp_cnp_handled moves | CNPs aren't reaching/affecting the sender — check CNP DSCP/priority (48 / prio 6) and that the return path preserves it |
rp_cnp_ignored climbing | Senders receive CNPs but don't throttle — DCQCN disabled on those QPs or a rate-limiter misconfig |
min_time_between_cnps too large / too small | Too large → receiver suppresses CNPs, reacts sluggishly; too small → CNP storms |
💡 What you should remember
| # | Concept | Why it matters | |
|---|---|---|---|
| 1 | 🔁 | ECN-first, PFC-rarely | A healthy loop marks ECN and fires CNPs while PFC stays near zero; PFC climbing without CNPs = DCQCN too slow. |
| 2 | 🎯 | Slice to TC3 (CNP on prio 6) | RoCE rides one priority — aggregate port counters hide the whole story. |
| 3 | 🔎 | Drops need a reason | WJH and the PFC watchdog turn "a packet was lost" into "which port, which queue, why." |
| 4 | ↔️ | Correlate NIC ↔ switch | packet_seq_err/out_of_sequence on the NIC + the switch's drop reason = the whole game. |
| 5 | 📈 | Watermarks lead PFC | Buffers fill before PFC fires — occupancy is your one-step-early warning. |
| 6 | ⚖️ | CNP is a balance sheet | np_cnp_sent on one node should meet rp_cnp_handled on another; rp_cnp_ignored is a red flag. |
Next: GPU & Job Telemetry → — the other half of the story: DCGM, the GPU_UTIL trap, XID errors, NCCL bandwidth, and finding the straggler rank.