GPU & Job Telemetry
The network exists to keep GPUs fed. So the GPU signals a network engineer cares about are the ones that reveal "the GPU is idle, waiting on the fabric." Half of "the network is slow" tickets are a GPU or host problem wearing a network costume — this page is how you tell the difference, and how the job hands the baton to the fabric when the fault really is on the wire.
It stays network-adjacent — not a full GPU-ops chapter — and centers on DCGM (the standard exporter) and NCCL (the collective library that actually drives the wire).
- Read the DCGM core metrics a network engineer needs, labelled by GPU UUID (your join key).
- Avoid the
GPU_UTILtrap — why it reads ~100% while a GPU spins idle, and whySM_ACTIVEis the honest number. - Derive "waiting on comms" — when
SM_ACTIVEdips in lockstep across ranks, the GPUs are blocked on a collective — that's network-attributed time. - Recognize the XID errors that point at the interconnect (74, 79, ECC family).
- Read NCCL bandwidth — busbw vs. algobw — and find the straggler rank with per-rank variance.
- Use MFU as the single top-line "are we wasting this cluster's money" trigger.
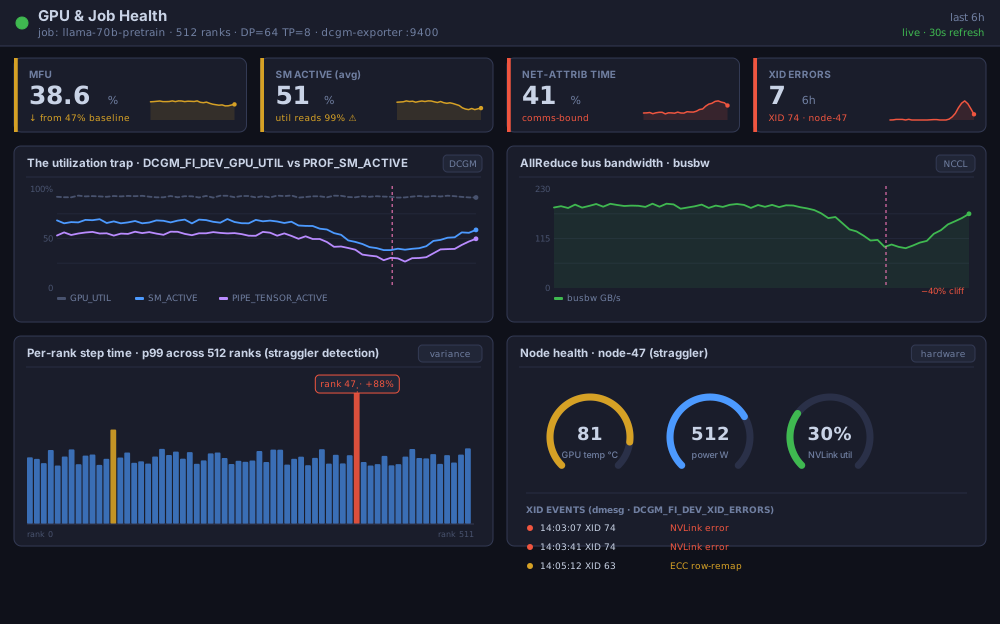
The GPU/job signals a network engineer reads — the GPU_UTIL trap, busbw cliff, per-rank straggler, and XID feed. Open the live interactive demo →
DCGM core metrics
dcgm-exporter runs as a daemonset and exposes GPU metrics at :9400/metrics for Prometheus, every field labelled with the UUID — your join key. The fields that matter to a network engineer:
| DCGM field | Meaning | Why the network cares |
|---|---|---|
DCGM_FI_DEV_GPU_UTIL | GPU utilization (%) | coarse "is a kernel running" — misleadingly high, see below |
DCGM_FI_PROF_SM_ACTIVE | ratio of cycles an SM has ≥1 warp | real compute occupancy — the honest utilization |
DCGM_FI_PROF_PIPE_TENSOR_ACTIVE | tensor (HMMA) pipe active ratio | are the tensor cores actually doing matmuls |
DCGM_FI_PROF_PCIE_TX_BYTES / _RX_BYTES | PCIe throughput (host↔GPU) | data-loading / staging pressure |
DCGM_FI_PROF_NVLINK_TX_BYTES / _RX_BYTES | NVLink throughput (GPU↔GPU) | intra-node collective traffic |
DCGM_FI_DEV_FB_USED / _FREE | framebuffer memory | OOM risk, batch/model sizing |
DCGM_FI_DEV_PCIE_REPLAY_COUNTER | PCIe retries | a flaky PCIe link starving a GPU |
DCGM_FI_DEV_POWER_USAGE / DCGM_FI_DEV_GPU_TEMP | power (W) / temp (C) | thermal throttling → slow ranks |
DCGM_FI_DEV_XID_ERRORS | last XID error code | hardware/driver faults (see below) |
DCGM_FI_DEV_CLOCK_THROTTLE_REASONS | throttle bitmask | why clocks dropped (thermal/power/etc.) |
GPU_UTIL is a trapIt reads ~100% whenever any kernel is resident — including a kernel spinning idle waiting for a collective to finish. Use DCGM_FI_PROF_SM_ACTIVE and PIPE_TENSOR_ACTIVE for truth. A job showing 99% GPU_UTIL but 45% SM_ACTIVE is not compute-bound — it's stalling, very often on the network.
The network-relevant signal: GPU stall / "waiting on comms"
This is where GPU observability and fabric observability meet, and it's the most valuable cross-domain signal you have. When SM_ACTIVE dips in lockstep across many ranks, the GPUs are blocked at a synchronization barrier — waiting for a collective to complete — which means they're waiting on the network.
A single GPU idling is a local problem; all of them idling together, periodically, is a comms problem.
Deriving it: correlate low SM_ACTIVE with the collective phase (NVLink / inter-node traffic high while tensor pipes idle) — that fraction of wall-clock is your network-attributed time, the number the fabric is directly responsible for.
XID errors that point at the fabric/interconnect (surfaced via DCGM_FI_DEV_XID_ERRORS and kernel dmesg):
| XID | Meaning |
|---|---|
| 74 | NVLink error — intra-node GPU↔GPU link trouble |
| 79 | GPU has fallen off the bus — a GPU vanished (often a hard fault) |
| 48 | Double-bit ECC error (uncorrectable) |
| 94 / 95 | Contained / uncontained ECC error |
| 63 / 64 | ECC row-remapping event / failure |
An XID 74 storm correlated with a straggler rank is a smoking gun: that node's GPU interconnect is degrading, and it's dragging the whole collective. (The full XID list is in NVIDIA's documentation; the above are the ones that recur in fabric incidents.)
NCCL telemetry
NCCL is what turns "the model needs to sync gradients" into actual RDMA on the wire, so its telemetry is the closest thing you have to per-collective network truth.
NCCL_DEBUG=INFOdumps topology, ring/tree construction, and per-collective detail to logs — the first thing to centralize.- busbw vs. algobw: algorithm bandwidth is the raw data rate; bus bandwidth normalizes for the collective's communication pattern and is the number you compare against the hardware ceiling. A busbw well under line rate on a specific collective = the network (or a straggler) is the bottleneck.
- The NCCL profiler plugin emits per-collective timelines (start/stop, size, algorithm) that you can export to Prometheus/OTel — this is your "trace" pillar for collectives.
Track per-collective duration and busbw over time, keyed by the collective type and the participating ranks. A sudden busbw cliff on AllReduce while AllGather is fine narrows the problem to a specific communication pattern and its hot links.
Straggler detection — per-rank variance
Collectives are barriers: the slowest rank sets the pace for all of them. So the highest-signal job metric is not any average — it's the variance across ranks. One rank running 8% slow doesn't make the job 8% slow at one rank; it makes every rank wait.
Watch per-rank step time (p50 vs. p99 across ranks) and per-rank busbw. When one rank consistently trails:
- Take its rank ID.
- Resolve it through the join-key chain → a specific GPU UUID, NIC, and switch port.
- Pull that port's RoCE counters.
This is the exact hand-off into the walk-down. Stragglers are where GPU observability hands the baton to fabric observability.
MFU — the north-star efficiency metric
Model FLOPs Utilization — achieved FLOPs ÷ the hardware's theoretical peak — is the single top-line number for "are we wasting this cluster's money." It rolls up compute efficiency, memory stalls, and network stalls into one figure. Large-scale training runs commonly target the ~35–50%+ range depending on model, parallelism, and hardware; a run that was hitting its MFU target and then sags is the symptom that sends you down the whole observability stack looking for the cause.
MFU has its own deep dive in 18.4 When Training Slows — MFU Diagnosis. Here it's the trigger, not the topic: MFU tells you that efficiency dropped; the layered signals and the walk-down tell you why.
💡 What you should remember
| # | Concept | Why it matters | |
|---|---|---|---|
| 1 | 🪤 | GPU_UTIL lies, SM_ACTIVE doesn't | 99% util with 45% SM active = stalling, not computing — usually on the network. |
| 2 | 🤝 | Lockstep SM_ACTIVE dips = comms | All ranks idling together, periodically, is the network's bill: network-attributed time. |
| 3 | 🧨 | XID 74/79 + a straggler = smoking gun | Interconnect degradation on one node drags the whole collective. |
| 4 | 📏 | busbw is NCCL's honest number | A busbw cliff on one collective type points at that pattern's hot links. |
| 5 | 🐢 | Variance beats averages | The slowest rank sets the pace — watch per-rank spread, then resolve the rank to a port. |
| 6 | 🌟 | MFU is the trigger, not the topic | A sagging MFU is the symptom that launches the walk-down. |
Next: Correlation & the Walk-Down → — the join keys that connect every layer, and the six-query path from a slow step to a single optic.