Correlation & the Walk-Down
This is the page the whole section is built to make possible. Detecting a slow job is easy. Localizing it — turning "the job is slow" into "this optic on leaf-12 port et33" — is the hard part, and on a fabric with tens of thousands of links it is impossible without one thing: every metric, from every layer, carrying a consistent identity so a single query can join a GPU to its NIC to its switch port.
Get the identity chain and the clock right, and root-causing a cluster-wide slowdown is six queries. Skip them, and every incident is a manual, all-hands hunt while the cluster burns money.
- Name the join-key chain — rank ↔ GPU UUID ↔ PCIe BDF ↔ ibdev ↔ netdev ↔ GID/IP ↔ QP ↔ switch port ↔ TC — and resolve each hop.
- Apply the label strategy — every scrape carries the same label set so a single PromQL query pivots across layers.
- Explain why time sync (PTP/NTP) is a prerequisite — without a common clock, five layers' signals can't be lined up.
- Run the walk-down — the six-query path from a slow step to a single marginal optic.
- Recognize the anti-pattern — beautiful, unjoinable per-layer dashboards that collapse observability back into monitoring.
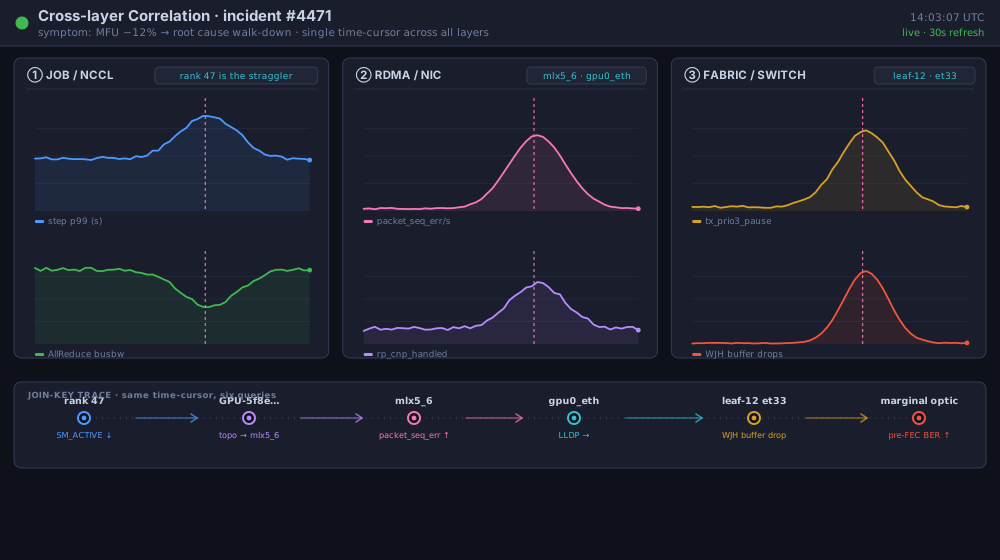
The walk-down as a picture: one time-cursor across all three layers, and the join-key trace from rank 47 to a single optic. Open the live interactive demo →
Join keys — the labels that make correlation possible
To walk a slow step down to a switch port, every metric has to carry a consistent identity so a query can join a GPU to its NIC to its switch port. That identity is a chain:
rank ↔ GPU UUID ↔ PCIe BDF ↔ ibdev (mlx5_x) ↔ netdev (gpuN_eth) ↔ GID / src-IP ↔ QP ↔ switch port ↔ TC / priority
Each hop is discoverable, and each is where correlation breaks if you don't record it:
| Hop | How you resolve it |
|---|---|
| rank → GPU UUID | training launcher / nvidia-smi -L (UUID is the stable GPU identity, not the ordinal) |
| GPU UUID → PCIe BDF, NIC affinity | nvidia-smi topo -m (which NIC is NUMA/PCIe-local to each GPU) |
| ibdev ↔ netdev | rdma link show, ibdev2netdev (maps mlx5_6 ↔ gpu0_eth) |
| netdev → GID / src-IP | show_gids / ibv_devinfo, the interface's RoCE IP |
| host port → switch port | LLDP neighbor (lldpctl) and the switch's show lldp neighbors |
| flow → egress port | ECMP/QP hashing over the 5-tuple; the switch fdb / flow tables |
| DSCP → TC / priority | your QoS map (commonly RoCE = DSCP 24 → prio/TC 3, CNP = DSCP 48 → prio 6) |
In Prometheus terms this means every scrape carries the same label set — hostname, gpu_uuid, rank, ibdev, netdev, and (via a join table or recording rule) switch and port. Do this and a single PromQL query pivots from "which rank was slow" to "what were that rank's NIC and switch-port counters doing at that instant."
You'll have a beautiful GPU dashboard and a beautiful fabric dashboard and no way to connect them — so every incident becomes a manual, error-prone correlation done by hand while the cluster burns money. The label strategy is not a nice-to-have; it is the observability.
The clock: why time sync is a prerequisite
Correlation is fundamentally about lining up signals from five layers on one timeline. If the GPU node thinks it's 14:03:07.2 and the switch thinks it's 14:03:07.9, the ECN mark and the SM-active dip they each recorded won't overlap — and the join you built with labels falls apart on the time axis.
That is why time sync (PTP or NTP) is a Tier-0 signal in the inventory, not a facilities detail:
- NTP (chrony) gets hosts to within a few milliseconds — enough for step-level correlation.
- PTP (
ptp4l, hardware-timestamped) gets sub-microsecond — needed if you want to align individual packet events (INT, mirror-on-drop) across devices. - Monitor the sync itself — chrony/ptp4l offset metrics via node_exporter. A drifting clock silently corrupts every correlation you do, and you won't know until an incident won't line up.
Join keys align signals on the identity axis; time sync aligns them on the time axis. You need both, or the walk-down below doesn't hold together.
The walk-down — slow step to root cause
Everything above exists to make this walk possible. Here it is end to end, as it actually runs during an incident.
① Symptom (Job layer). MFU drops 12%. Step-time p99 climbs while SM_ACTIVE sags — GPUs are stalling, not computing. → Not compute-bound; suspect comms.
② Localize (Collective layer). Per-collective metrics show AllReduce busbw fell ~40% on the slow iterations; AllGather is fine. → A specific communication pattern is affected.
③ Find the rank (Job/NCCL). Per-rank step-time variance fingers rank 47 as the consistent trailer. → One node is the straggler.
④ Resolve identity (join keys).
rank 47 → GPU-UUID GPU-5f… → nvidia-smi topo → mlx5_6 → ibdev2netdev → gpu0_eth
gpu0_eth → LLDP neighbor → leaf-12, port et33
⑤ Read the NIC (RDMA layer). On rank 47's mlx5_6:
rdma statistic show link mlx5_6/1 | grep -E 'packet_seq_err|out_of_sequence|rp_cnp_handled|local_ack_timeout_err'
packet_seq_err and rp_cnp_handled are both climbing → this NIC is seeing loss/reorder and being told to slow down.
⑥ Read the switch (Fabric layer). On leaf-12 port et33:
show pfcwd stats | grep Ethernet33          # storming?
# + WJH: any TC3 buffer drops on et33?
show queue counters Ethernet33              # TC3 drops / watermark near xoff?
WJH reports TC3 buffer drops on et33; tx_prio3_pause is rising. → This port's lossless queue is overrunning.
Root cause (Physical layer, confirm). ethtool -m on the port shows one optic with rising pre-FEC errors, degrading throughput and forcing retransmits that congest the queue. → One marginal optic on leaf-12 et33 is the root cause of a cluster-wide 12% MFU loss.
The whole chain took six queries because every metric carried the same join keys and every clock agreed. Without them, step ④ onward is guesswork.
Topology as a first-class asset
The walk-down leans on a fact most fabrics don't keep well: the topology graph itself. "Which switch port does rank 47 hash to?" is only answerable if you continuously maintain the rank→GPU→NIC→port→leaf→spine mapping as data, not tribal knowledge.
- Source of truth: LLDP neighbor tables (host ↔ switch) plus the fabric's own topology, reconciled against the cabling plan. Export it; don't keep it in a spreadsheet.
- Keep it live: re-derive on every link event — a re-cabled port silently breaks every correlation that trusts the old map.
- Flow-path attribution: which ECMP member a 5-tuple took is computable from the hash, and sampled reality comes from sFlow/IPFIX — that's how you catch hash polarization putting rank 47 on a hot link.
Topology is what turns a pile of per-device counters into a fabric you can reason about. It is the difference between "some port is dropping" and "the port this straggler traverses is dropping."
💡 What you should remember
| # | Concept | Why it matters | |
|---|---|---|---|
| 1 | 🔗 | The join-key chain | rank ↔ GPU ↔ NIC ↔ port ↔ TC on every metric is what makes localization possible. |
| 2 | 🏷️ | Same label set on every scrape | One PromQL query then pivots across all five layers. |
| 3 | ⏱️ | Time sync aligns the time axis | Labels align identity; PTP/NTP aligns the clock — you need both. |
| 4 | 🚶 | The walk-down is six queries | Symptom → collective → rank → identity → NIC → switch → optic. |
| 5 | 🗺️ | Topology is a live asset | Maintain the graph as data; a re-cabled port breaks stale correlations silently. |
| 6 | 🚫 | Unjoinable dashboards = monitoring | Pretty per-layer dashboards you can't connect are the most expensive mistake. |
Next: The Telemetry Pipeline → — how all these sources flow into collection and storage without melting under the cardinality.