Life of an AI Job in Fabric
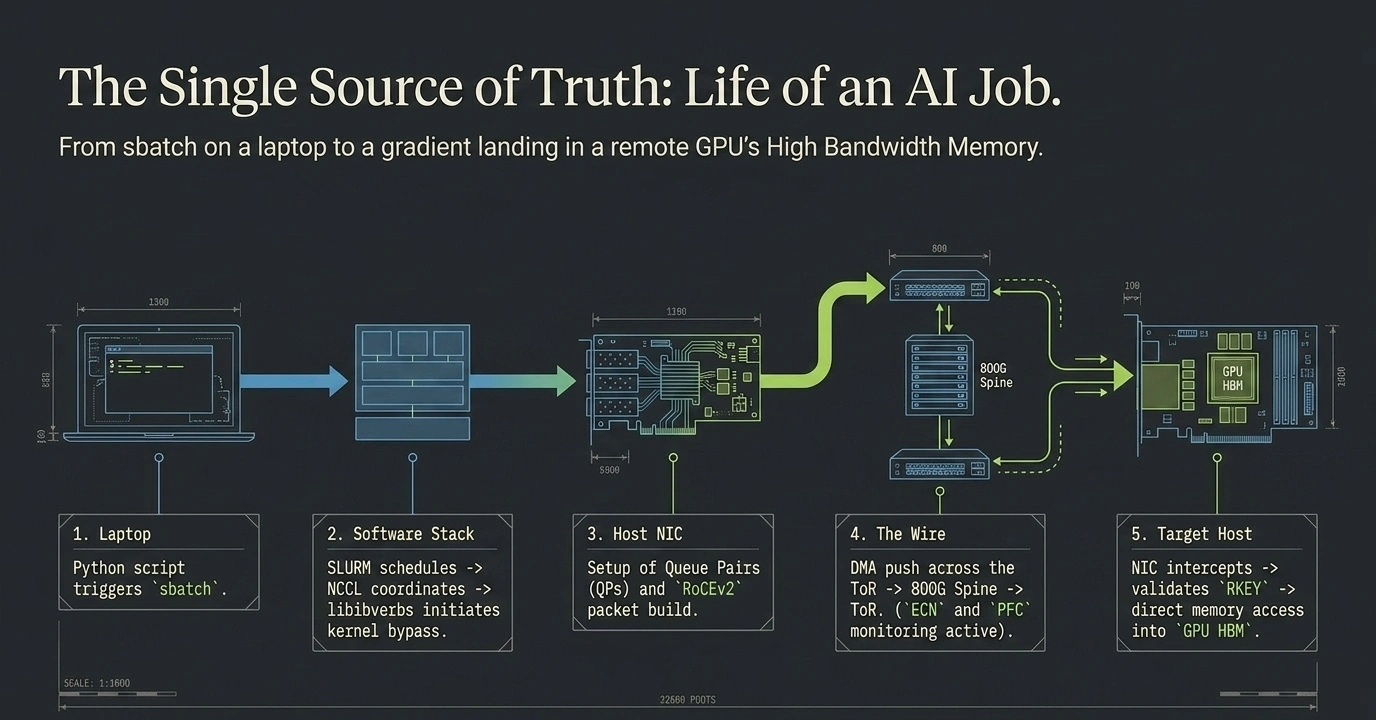
From sbatch on a laptop to a gradient landing in remote GPU HBM. Five states, every event in order, every protocol named. The animation below walks each step in motion.
When you type google.com into a browser, you can recite the lifecycle from memory — DNS, TCP handshake, TLS, HTTP request, response, render. This page does the same for an AI training job. Five clean states, every event in order, every protocol named.
First: four physical networks in a production AI cluster
A real AI cluster has four physically separate networks, each with its own leaves and spines. They share the same datacenter floor but never share switches:
| Network | Speed | Who's on it | Carries |
|---|---|---|---|
| 🟣 Backend Network | 400 G RoCEv2 | GPU servers (4–8 NICs each, one per GPU rail) | Collective communication — AllReduce, AllGather. Lossless via PFC + ECN. |
| 🟢 Frontend Network | 100 G / 25 G | X86 head nodes, k8s control plane | kubectl, API server, etcd, image pulls, monitoring, NCCL TCP rendezvous, SSH |
| 🔵 Storage Network | 100 G | X86 head nodes + storage servers | NVMe-oF batches in, checkpoints out — its own dedicated fabric |
| ⚫ Out-of-Band (OOB) | 1 G | All switches + servers (BMC/IPMI ports) | Switch management, hardware health, firmware updates — totally separate from data path |
GPU servers sit on the Backend only (for collectives). X86 head nodes sit on both Frontend + Storage (control plane and data access). Storage servers sit on the Storage Network only. Every switch and server is also reachable on the OOB for management.
NVLink is not on this picture — it's a GPU-to-GPU bus inside each server chassis (silicon-level, ~900 GB/s per H100). It never crosses any external network.
Submit → Schedule → Pods running
From kubectl apply to four containers actually running. Pure control plane — Kubernetes API, etcd, scheduler, kubelet, container runtime — all on the Frontend Network. The Backend (RoCEv2) and Storage networks are completely idle.
- 1. You run
kubectl apply -f myjob.yaml. The spec says:nodes: 4,gpus: 4/node,rdma/hca: 4, container image. - 2. kube-apiserver validates the PyTorchJob and runs the Training Operator's admission webhook (checks GPU + RDMA quotas).
- 3. Spec is written to etcd. Scheduler is notified of 4 pending pods.
- 4. Scheduler does gang scheduling — all 4 pods placed atomically, or the job waits. No partial allocation.
- 5. Topology-aware placement: prefers nodes with the same
topology.kubernetes.io/racklabel to minimise cross-leaf traffic. - 6. kubelet on each chosen node receives the pod spec and pulls the container image (
nvcr.io/nvidia/pytorch:24.04-py3, ~10 GB). - 7. Device plugins mount
/dev/nvidia0..3and/dev/infiniband/uverbs0..3into the container namespace. - 8. Containers start. Pods running.
- Key takeaway: the compute fabric saw zero RDMA traffic this entire state. Everything was TCP control plane.
The five states at a glance — which network is active
| # | State | Active network(s) | Util |
|---|---|---|---|
| 1 | Submit → Schedule → Pods running | Frontend only | ~1.5% |
| 2 | NCCL bootstrap | Frontend (TCP rendezvous) → Backend (QPs come up) | ~5% |
| 3 | Data ingest + Forward pass | Storage Network + NVLink intra-server | ~28% |
| 4 | Backward + AllReduce | Backend Network | ~98% |
| 5 | Optimizer + Checkpoint + Loop | Storage Network (write back) | ~42% |
Notice: the Backend Network — the expensive 400 G RoCEv2 monster — only does real work during State 4. It's dark ~70% of the time. Three of the four networks see almost no traffic from a job's collective phase. That's why AI fabric design is all about the Backend, and specifically about State 4.
Three things a network engineer should walk away with
- The Backend Network only matters during AllReduce (State 4). Everything before it is setup; everything after is local or storage. Design and troubleshoot the Backend with State 4 as the north star.
- AllReduce is synchronised, not random. All 16 GPUs post RDMA WRITEs in lockstep. That's the traffic shape that breaks ECMP and motivates rail-optimised topology + adaptive routing. See Hash Polarization.
- One iteration ≈ hundreds of milliseconds. Training does ≈1 million of them. A 1 ms tail delay per iteration compounds into hours of wasted GPU time. Tail latency is the design constraint, not average throughput.